
Top DEX Flow Tokens
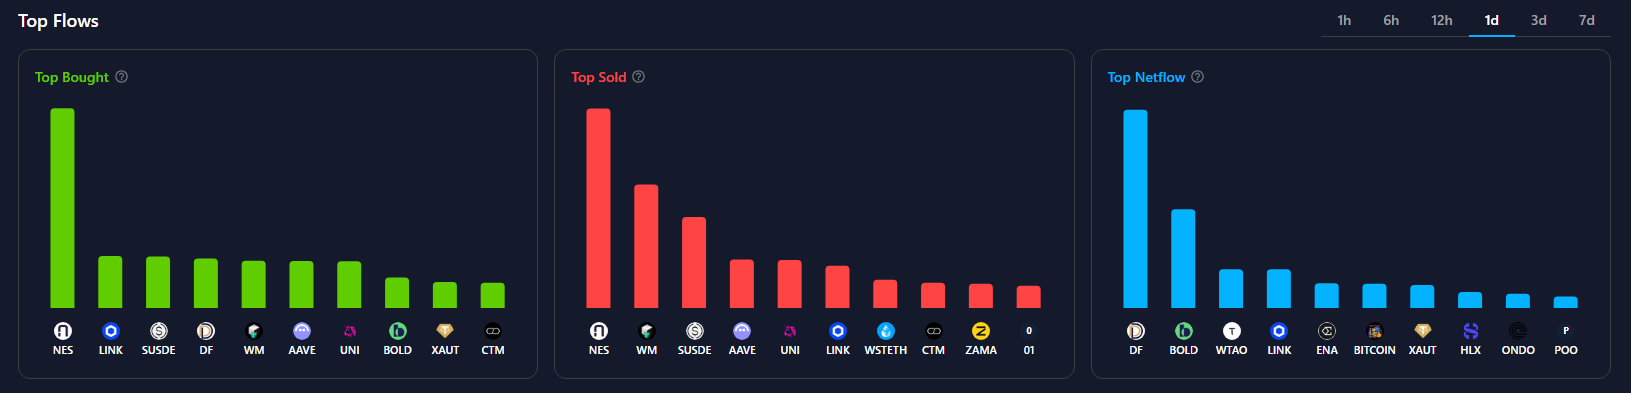
Top Buying
Displays the tokens with the highest total buy volume across supported decentralized exchanges. High buy volume often indicates increasing demand and growing market interest.Top Selling
Displays the tokens with the highest total sell volume during the selected timeframe. Large sell volume may indicate profit-taking, distribution, or increased selling pressure.Top Netflows
Ranks tokens based on the difference between total buy and sell volume. A positive net flow indicates more capital entered the token than exited it, while a negative net flow indicates stronger selling activity. Net flow provides a quick indication of overall market sentiment and capital movement.Netflow Volume = Buy Volume - Sell Volume
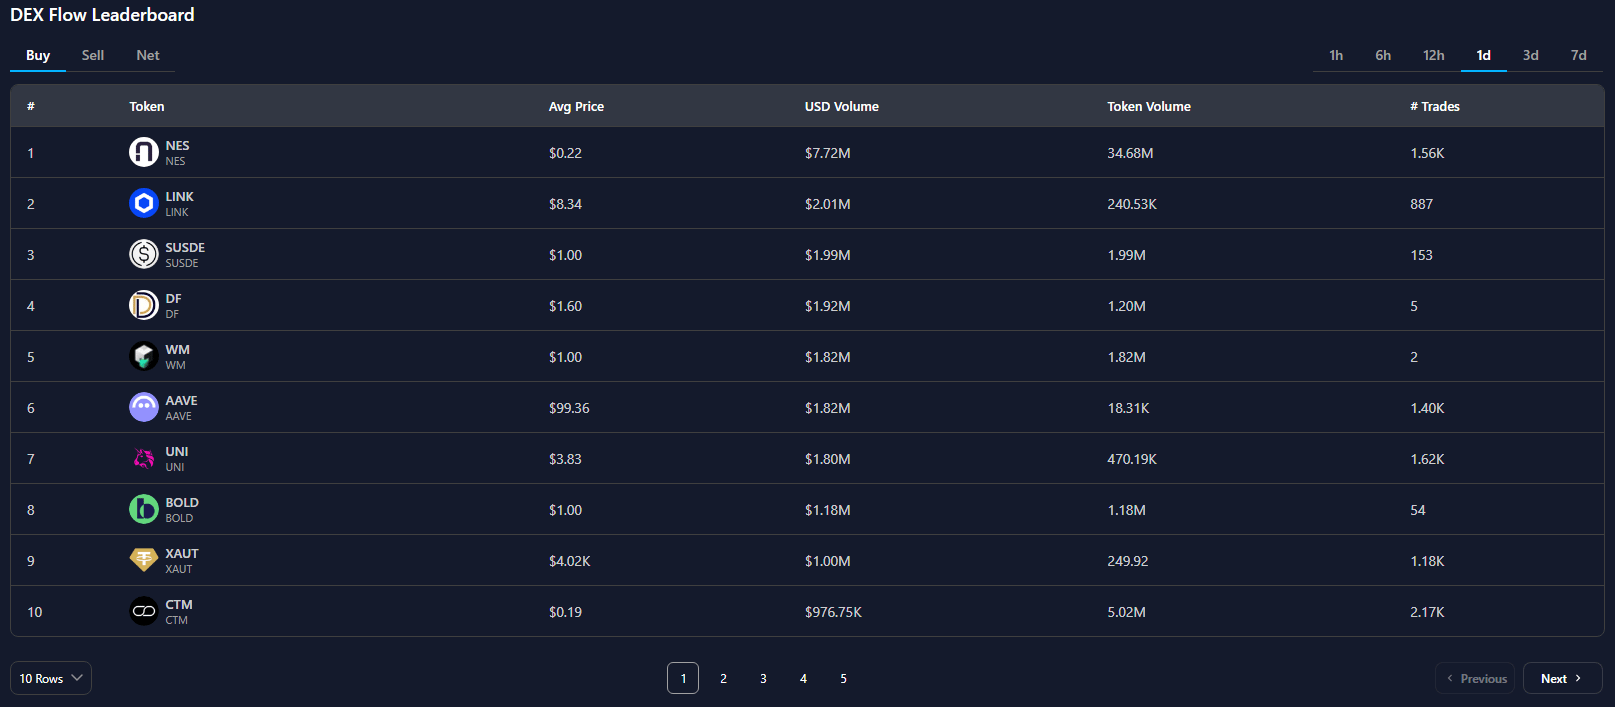
DEX Flow Leaderboard
Timeframe Selection
Select a timeframe to analyze trading activity over different periods, including 1 hour, 6 hours, 12 hours, 1 day, 3 days, and 7 days. The leaderboard is automatically updated based on the selected timeframe.Flow Type
Choose one of the following tabs to view different market perspectives:- Buy – Ranks tokens by total buy volume.
- Sell – Ranks tokens by total sell volume.
- Net – Ranks tokens by net capital flow (buy volume minus sell volume).
Leaderboard Columns
For each token, DEXUtils displays the following information:- Rank – The token’s position in the selected leaderboard.
- Token – The token’s logo, name, and symbol. Click the token to open its Token Analytics page.
- Average Price – The average trading price during the selected timeframe.
- USD Volume – The total value of DEX trades executed in USD.
- Token Volume – The total quantity of tokens traded.
- # Trades – The total number of completed DEX trades.